Navigating Current Market Fluctuations
Written by Tim Moore, Financial Advisor
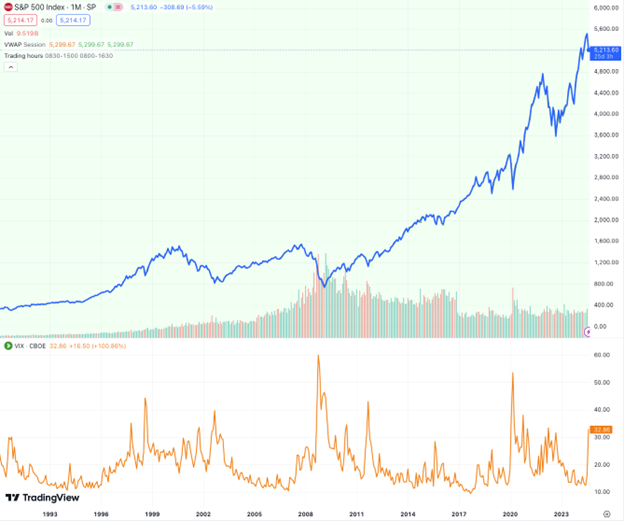
The markets sold off dramatically on Monday, August 5th on fears of a cooling economy and that the Federal Reserve was being too slow to lower interest rates, risking sending the country into a recession. The CBO Volatility index, known as the VIX, did something it hasn’t done since the Great Financial Crisis of 2008.
| VIX Rating | General market sentiment based on VIX |
| 0-15 | This can indicate a certain amount of optimism in the market as well as very low volatility. |
| 15-25 | This can indicate that there is a certain amount of volatility, but nothing extreme. |
| 25-30 | This can indicate that there is a certain amount of market turbulence and volatility is increasing. |
| 30+ | This can indicate that the market is highly volatile and there may be some extreme swings soon. |
Jonathan Krinsky, chief market technician at BTIG2, pointed out that for a brief period, the spread between the spot VIX and its second-month futures contract reached a deeply negative 30 points, exceeding its most recent lows reached during the depths of the COVID-19 selloff. On a closing basis, this would have been the widest level since October 2008, Krinsky said.
What does this mean for the market in the near term? To put it simply, no one knows! Some speculate this is the beginning of a deeper selloff, that we are heading into a bear market, a recession, or it’s a massive bubble bursting. Others point to the fact that dramatic spikes in the VIX to these levels often point to the end of a sell-off cycle rather than the beginning, and the recent moves help to make stocks more reasonably priced again.
As long-term investors and financial advisors, we are not concerned with the day-to-day fluctuations of the market, but rather use these moments to our advantage by putting new money to work when available. In fact, if you look at the data, you may be surprised how well the market tends to do after dramatic days like this.
There have been 9 instances since 19903 when the VIX has moved from a relatively calm level to above 30 like it did on August 5th. We wanted to see what the S&P 500 returned 3 months, 6 months, 1 year, and 3 years later.
Here are the results:
| Time Period | Instances of Gains | S&P Average Gain | S&P Median Gain |
| After 3 Months | 8 of 9 | 9% | 11% |
| After 6 Months | 8 of 9 | 15% | 22% |
| After 1 Year | 8 of 9 | 23% | 27% |
| After 3 Years | 9 of 9 | 45% | 54% |
What is also interesting to note is the majority of the VIX spikes came in the months of August, September, and October. You can see that seasonality often plays a factor in this not-so-unusual occurrence.
Key Takeaway: when the market acts up, zoom out, diversify, and make sure your financial plan accounts for the ride!
1 https://www.td.com/ca/en/investing/direct-investing/articles/understanding-vix
2 A global financial services firm specializing in investment banking, institutional trading, research and related brokerage services.
3 August 1990, October 1997, July 1998, October 2001, September 2002, October 2008, June 2010. September 2011, March 2020
4